The Complexity of Insurance Concepts and the Power of Infographics
Insurance often appears daunting to consumers, weighed down by technical jargon and detailed documentation. Yet, in today’s fast-paced world, consumers crave simplicity and clarity—especially when it comes to financial security. For marketing professionals in insurance, bridging this gap between complexity and comprehension is paramount.
This is where infographics come into play. By turning intricate information into visually appealing content, infographics offer an accessible way to explain policies, processes, and benefits, reducing apprehension and fostering trust.
Why Insurance Needs Visual Storytelling: The Case for Infographics
Insurance terminology and product details are typically complex. For many clients, terms like “deductible,” “premium,” and “policyholder liability” might seem alien. This disconnect can lead to confusion and a reluctance to engage with your brand.
Benefits of Visual Storytelling
- Increased Comprehension: Infographics distill complex ideas, making essential insurance concepts accessible. Visuals help break down abstract terms into concrete ideas, enabling clients to understand what they’re signing up for.
- Enhanced Engagement: Infographics hold attention better than dense text, making it easier to engage clients in meaningful ways.
- Improved Retention: Research shows that people remember visual information far better than text alone, meaning clients are more likely to recall key details about policies and procedures.
How Infographics Drive Engagement and Customer Satisfaction in Insurance
By making insurance content visually digestible, infographics create a seamless way for consumers to navigate your offerings. This can significantly boost engagement and improve customer satisfaction.
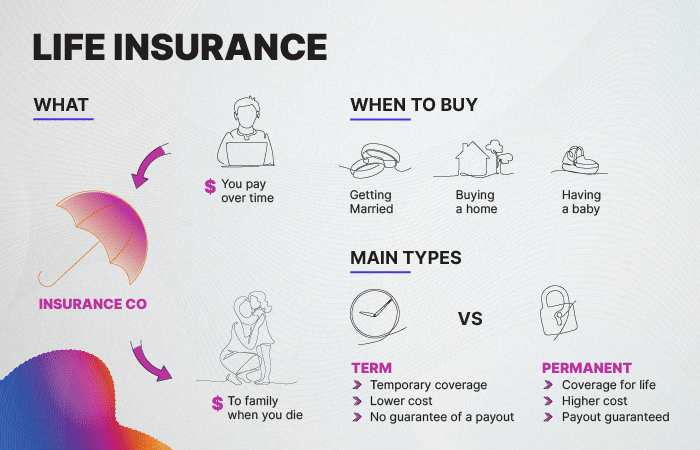
- Clarity Through Visuals: Infographics can make abstract concepts, such as underwriting and risk assessment, feel more accessible. For example, a step-by-step
graphic explaining the claims process can alleviate anxieties about the journey from incident to reimbursement. Here is an example of an infographic explaining “Life Insurance” in a simple way.
- Consumer Confidence: When clients feel informed, they are more likely to trust your brand and feel confident in their choices, ultimately leading to stronger loyalty and retention.
- SEO and Shareability Benefits: Infographics are popular on social media, and people are more likely to share visual content, which can expand your reach organically. These visuals can lead to higher dwell times and reduce bounce rates, boosting SEO performance. Sources: LinkedIn
Types of Effective Infographics for Insurance Concepts
Tailored infographics can make even the most technical topics accessible. Here are some impactful types:
- Process Infographics: Step-by-step visuals guide customers through processes like filing claims or renewing policies. For example, “How to File a Claim in 5 Easy Steps” helps reduce friction in a potentially stressful situation.
- Comparison Infographics: Highlight differences between policy types, such as term vs. whole life insurance. This allows clients to quickly identify which options suit their needs.
- Cost Breakdown Infographics: Demystify premium calculations or explain add-ons to show the value of various options, helping clients make informed financial decisions.
- Decision-Making Infographics: Visual aids like “Do I Need This Coverage?” empower clients to navigate insurance offerings based on their specific life circumstances.
Best Practices for Creating Effective Insurance Infographics
Creating insurance infographics requires careful attention to detail and audience-focused design. Consider these best practices:
- Design Simplicity: Avoid visual clutter. Instead, opt for a minimalistic design that highlights essential information and enhances readability.
- Data Accuracy: Insurance data must be precise. Ensure all information is up-to-date to maintain credibility with your audience.
- On-Brand Style: Keep colors, fonts, and icons consistent with your brand’s identity. This builds trust and reinforces your brand’s image.
- User-Centered Design: Focus on common client questions or pain points. Make infographics intuitive by including relatable scenarios, guiding them through complex decision-making processes.
Leveraging an Offshore Creative Production Partner to Develop Engaging Insurance Infographics
Creating high-quality infographics consistently requires a mix of creativity, expertise, and resources. For many insurance brands, working with an offshore creative production partner can be an effective way to meet these needs without overextending in-house teams or budgets.
Why Offshore?
An offshore production partner brings a unique blend of creative talent and cost-efficiency, offering scalable resources that can enhance your marketing impact. Teams with experience in the insurance industry understand the importance of accuracy, clarity, and insight in visual content—ensuring your infographics not only look appealing but also effectively communicate key information.
Streamlined Production with Smartshoring®
Our Smartshoring® model combines the best of both worlds—regional client services teams who are familiar with local market nuances and offshore production hubs that provide affordability and scalability. The result is a seamless, culturally aligned process that allows you to produce content that feels tailored to your brand while optimizing resources.
Benefits of an Smartshoring Partner for Infographic Creation
- Cultural Alignment: Having an Account Manager ensures a smooth process, really taking the time to onboard properly to understand the company culture and nuances.
- Communication Efficiency: Considering time zones, language proficiency, and the availability of local account managers to ensure effective and timely communication.
- Quality Standards: Prioritizing regions or teams that can consistently meet or exceed the company’s quality standards through better oversight and integration.
Conclusion: Transforming Insurance Communication with Creative Infographics
In today’s competitive insurance landscape, clarity and simplicity are essential. Infographics serve as a powerful tool to make complex insurance concepts accessible, helping clients feel informed, confident, and engaged. By transforming intricate details into visually appealing formats, insurance marketers can overcome one of the biggest hurdles in the industry—consumer hesitation and confusion.
For insurance brands looking to scale their infographic efforts without straining resources, partnering with an offshore creative production team is a strategic advantage. An offshore partner with experience in the insurance sector brings a blend of creativity, cost-effectiveness, and scalability, allowing you to meet content demands efficiently.
With our Smartshoring® model, you gain the benefits of both regional client service teams who understand your brand’s voice and offshore production hubs that provide high-quality content at a sustainable cost. This collaborative approach ensures culture, communication & quality are always on point.
By incorporating infographics into your strategy and leveraging offshore expertise, your insurance brand can bridge the gap between complexity and clarity—fostering trust and deeper connections with clients. Embrace the power of visual storytelling and elevate your brand’s communication today.


